
The Barkley Marathon #StatPack
Barkley Stats & Odds Of Finishing...

If you’re reading this, you already know what the Barkley Marathons is.
You know about the secretive nature of entry, the course, the car licence plates and the fee.
You know about the books. You know about the yellow gate and the cigarette-lighting race director. And if you don’t, there are documentaries, essays and war stories that explain the mythology better than another recap ever could.
So this isn’t that…this is the Barkleys StatPack.
Everything you wanted to know or didn’t want to know.
The numbers on the back of those licence plates.


📸 Laz Lake aka Gary Cantrell - Photo: David Miller 📸
Myth Meets Data
The Barkley is famous for being unknowable. But when you stack the data year on year, attempt on attempt, something interesting happens:
It becomes predictable in shape even if it remains unpredictable in outcome.
This analysis covers 1995–2026. Not including the 1986–1994 pre-first-finisher era. That’s intentional as 1995 is not only when the first official finish happened but also when the core of the course evolved into what it is today.
So we’re effectively analysing the modern, measurable Barkley.
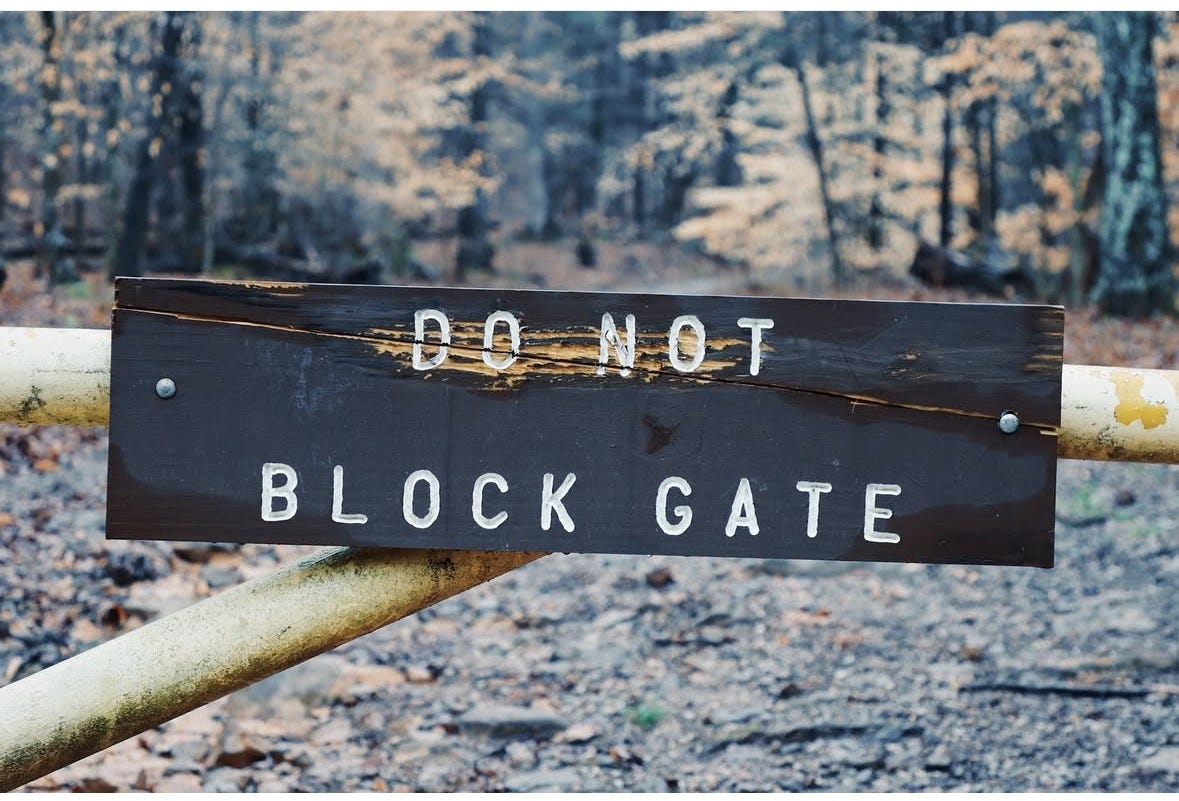
📸 Do Not Block Gate - Photo: David Miller 📸
The Big Picture: Statistically Hostile
1995–2026 - Complete Dataset
Total starters: 987
Total finishers: 26
Overall completion rate: 2.63%
That’s roughly 1 in 38 starters.
Not “hard race” territory. Not “elite race” odds. Lottery-adjacent odds.
And it gets worse when you look at the funnel.
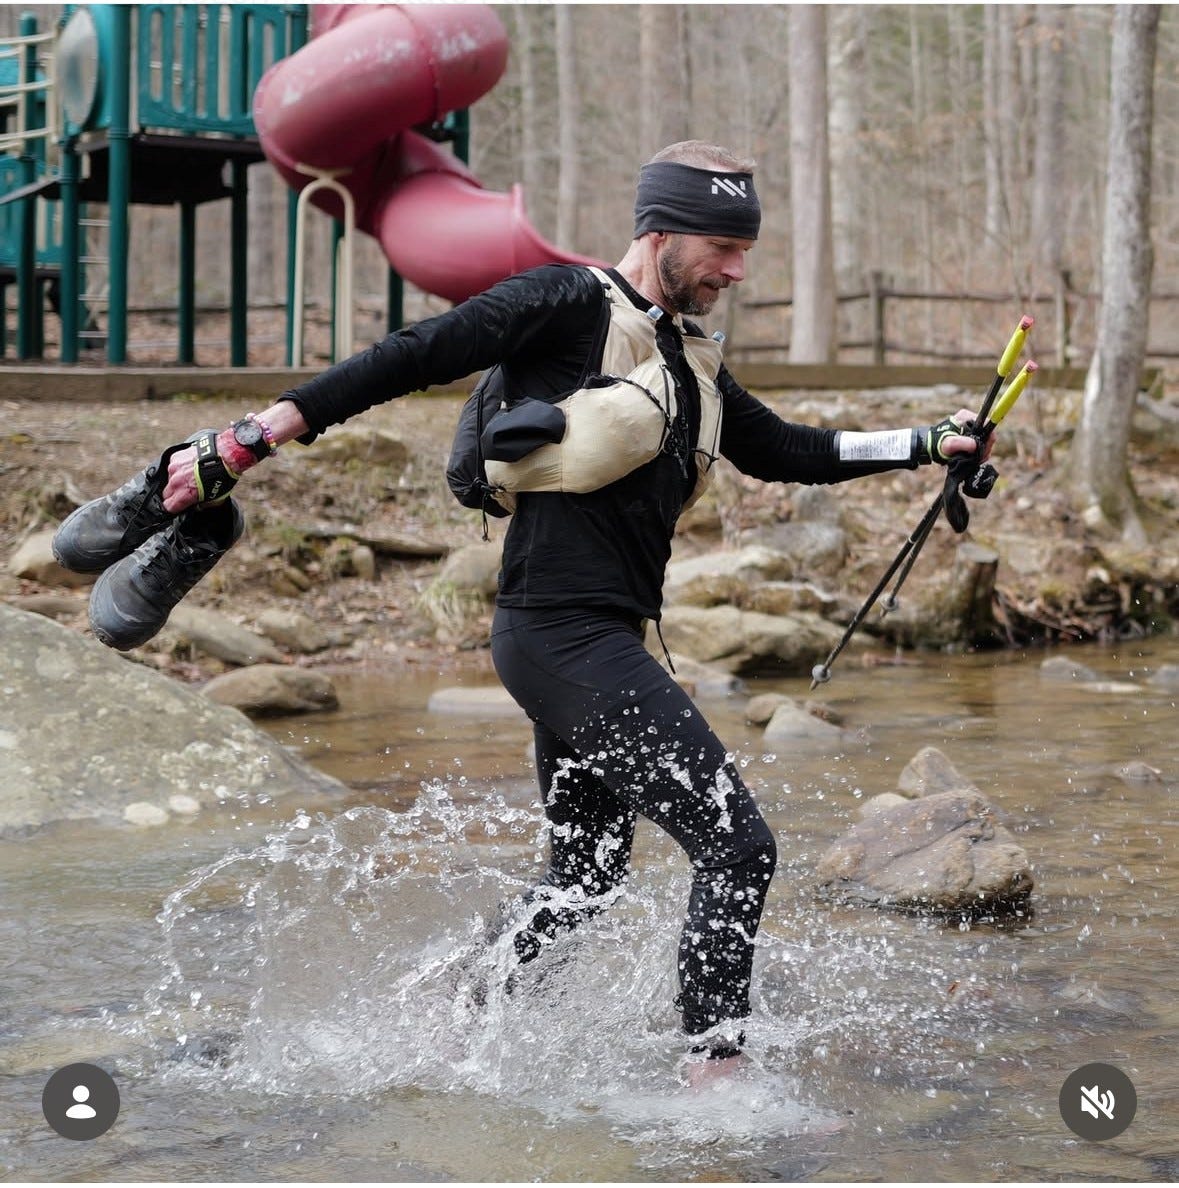
📸 Jasmin Paris - Photo: David Miller 📸
The Funnel: Where Dreams Actually Die
Here’s the breakdown of cumulative progression through the course:
Start: 100% (987 runners)
Reach Loop 1: 66%
Reach Loop 2: 25%
Reach Loop 3 (Fun Run): 9.3%
Reach Loop 4: 3.5%
Finish: 2.63% (26 runners)
Loop 1 alone wipes out nearly a third of the field. Loop 1 and Loop 2 together do most of the damage; roughly 78% of all DNFs happen before anyone reaches the Fun Run.
The biggest collapse isn’t late. It’s early.
The finish line isn’t where Barkley breaks people. It’s the first two loops in the dark, in the cold, before the field even has a chance to thin properly.
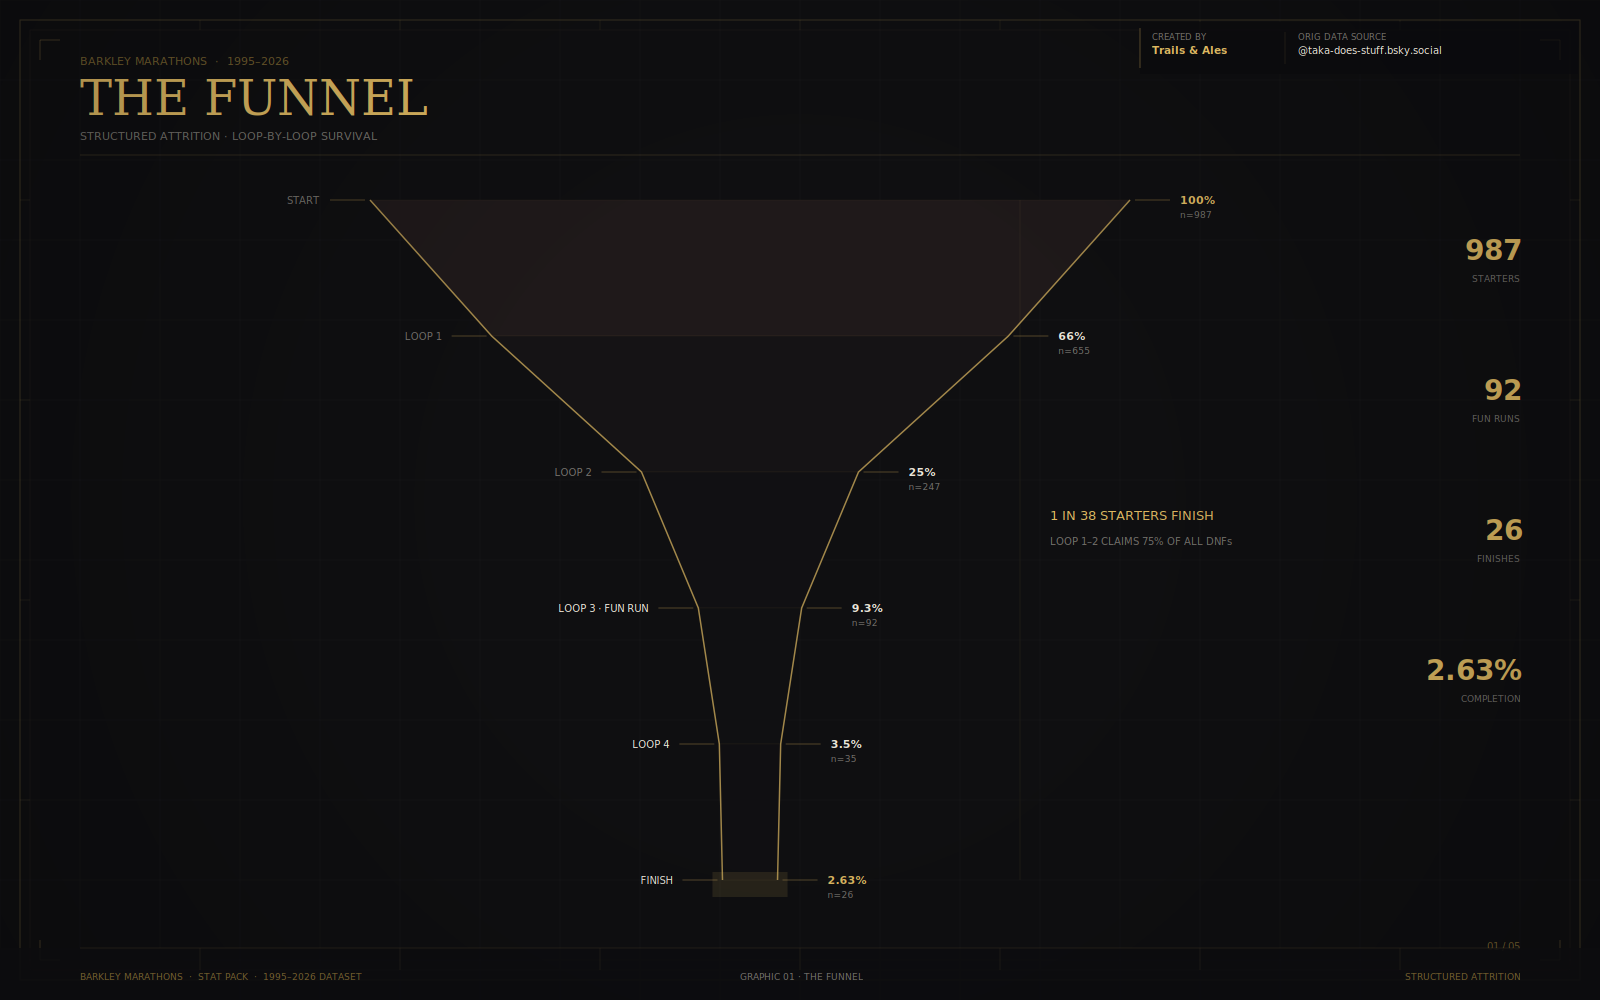
📊 THE FUNNEL · Structured Attrition · Loop-by-loop Survival · 📊
The Saw Blade: Year-by-Year Volatility
Completion rate swings wildly year to year. There’s no clean upward line. What you get instead is:
Multiple zero finisher years. Occasional spike years with 3–5 completions.
A jagged, unpredictable saw blade of a chart.
Weather, field strength, Laz course tweaks, it swings hard. Barkley isn’t steadily getting easier. It’s episodic.
But zoom out and something real emerges. A 3-year rolling average tells a quieter story; average loops completed per starter has nearly doubled since the early modern era.
Era Completion Rates
1995–2005: 1.2%
2006–2015: 2.4%
2016–2026: 3.9%
The finish line is still brutal. But more runners are surviving deeper.
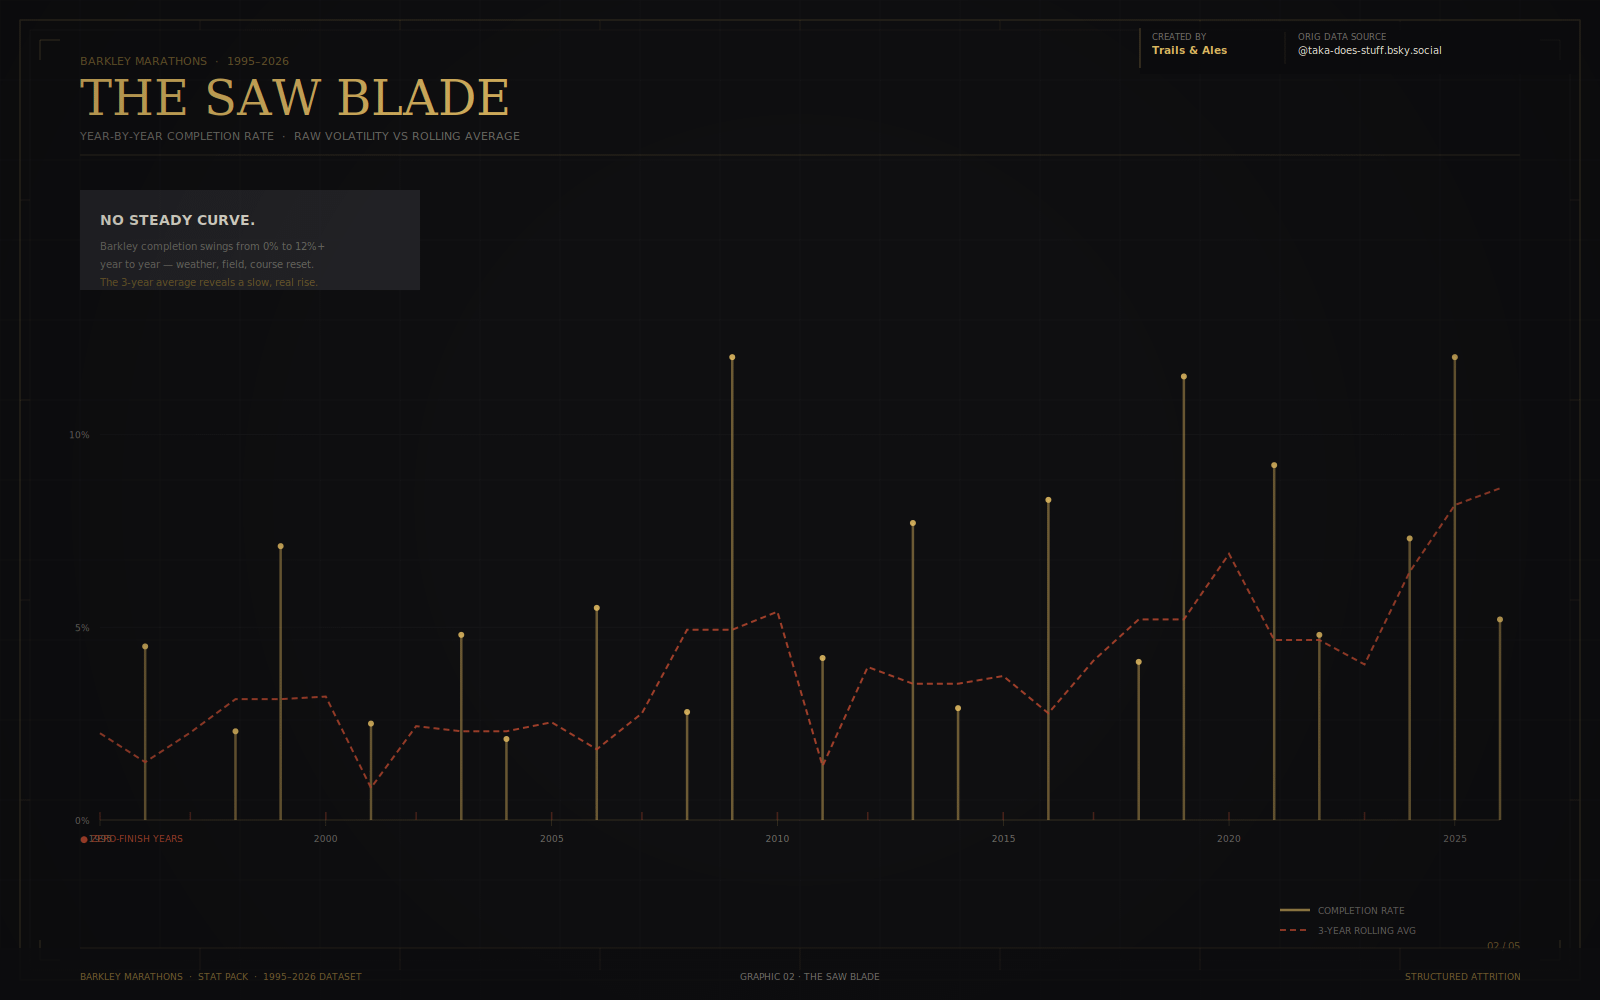
📊 THE SAW BLADE · Year-by-Year Completion Rate · 📊
US vs International: Myth or Marginal Edge?
Geographic Split across 1995–2026
US Starters: 62%
US Finishers: 65%
There’s a slight home skew. But it’s not dominance. The Barkley doesn’t really care what passport you hold.
International runners are now reaching Loop 3 &Loop 4 more consistently than a decade ago. The field globalised before the finishers did which suggests the gap is narrowing, not widening.
US finish rate: 3.42%
International finish rate: 2.14%
Marginal advantage. Not home dominance.
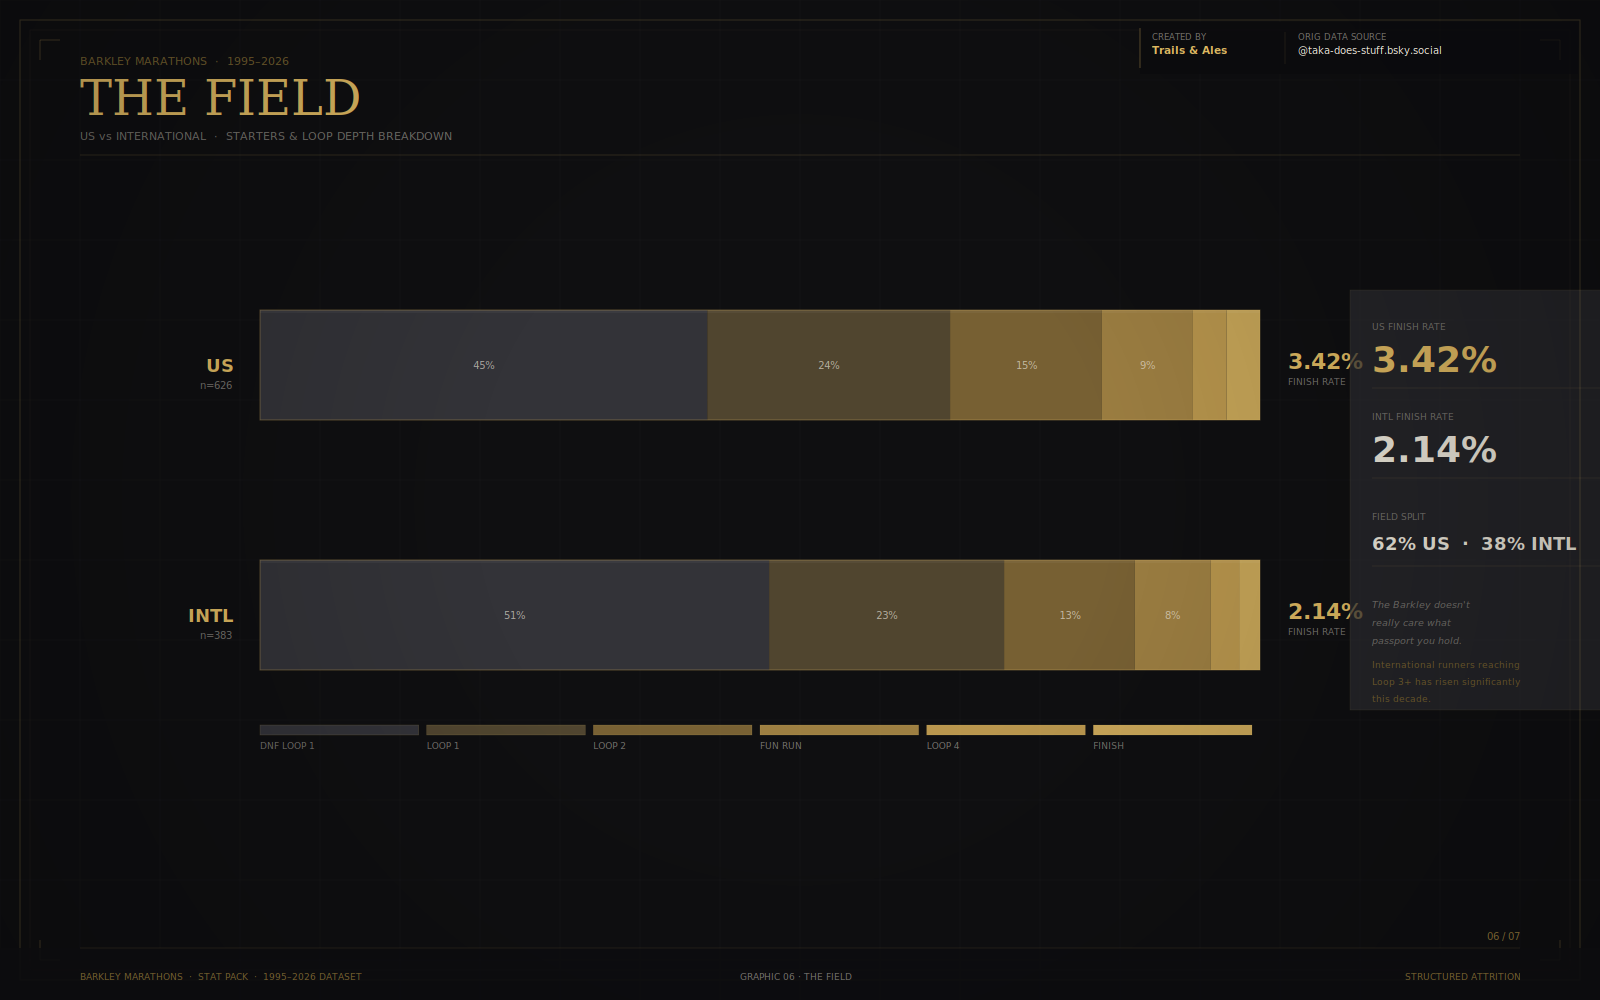
📊 THE FIELD · US vs International ·📊
Male vs Female: The Stark Reality
Gender Breakdown across 1995–2026
Male starters: 815 | Female starters: 138
Male finishers: 25 | Female finishers: 1
Male completion rate: 3.07%
Female completion rate: 0.72%
That stat speaks for itself. Only one female finisher so far…written factually, not sensationally that’s just what the numbers say.
Female participation is trending upward; Fun Run completions from female runners have increased in the last 5–7 years. Depth precedes breakthrough and history shows Barkley shifts slowly…then suddenly.
The field is diversifying. The finisher list just hasn’t caught up yet.
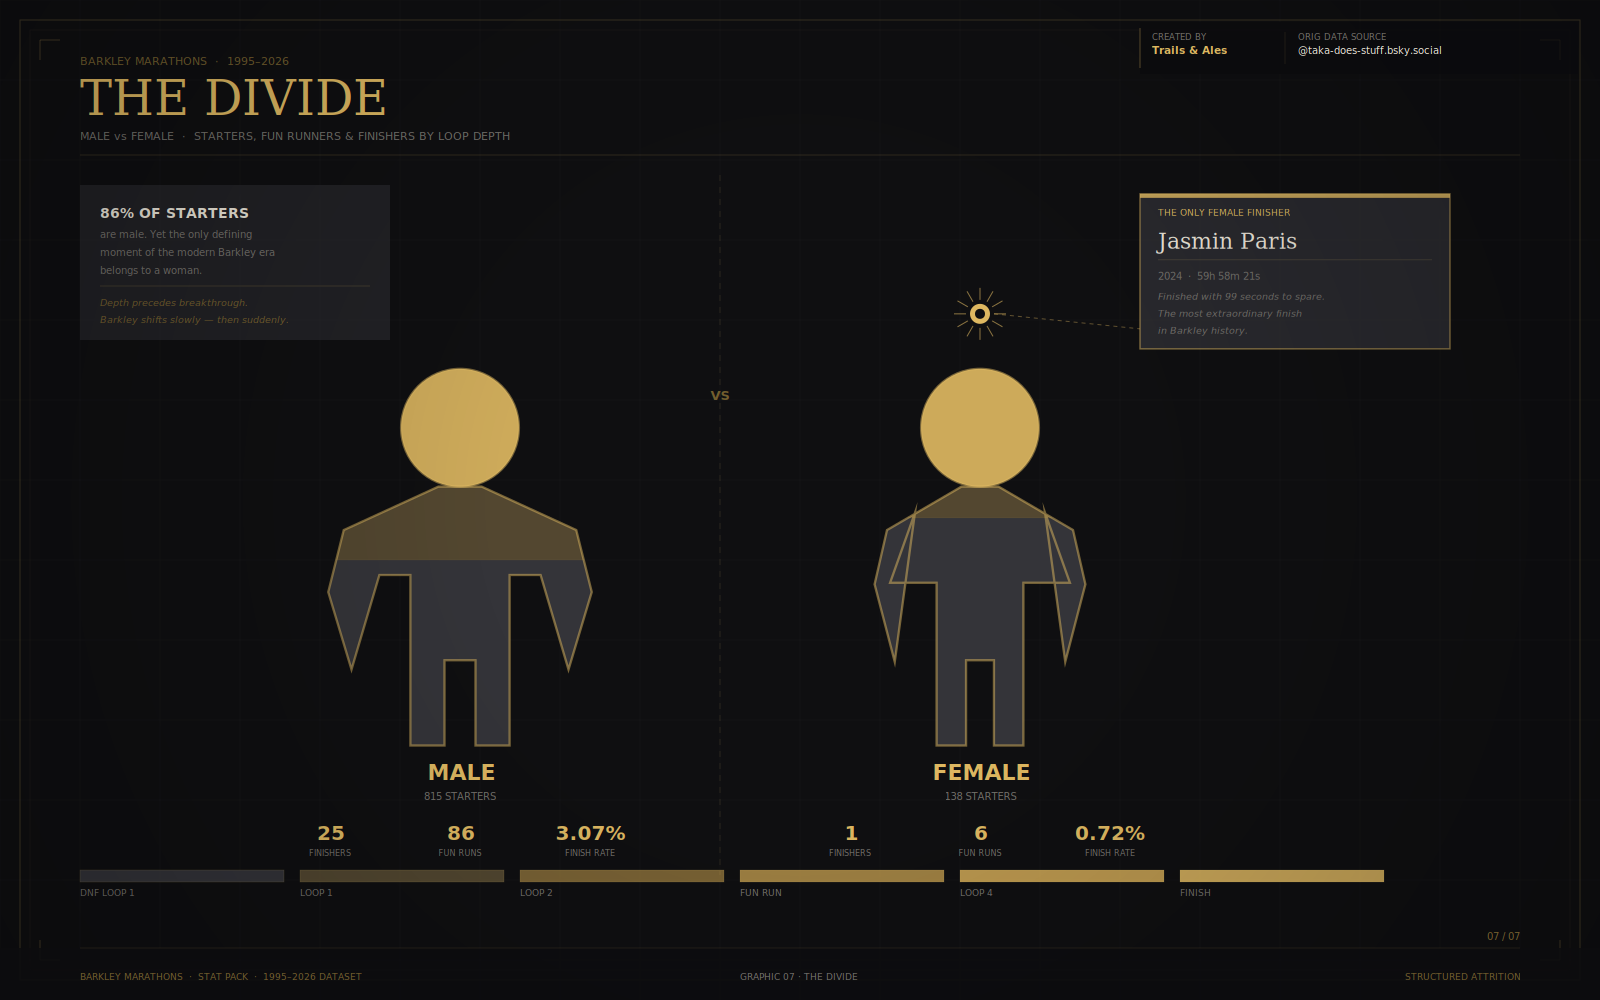
📊 THE DIVIDE · Male vs Female: Starters, Fun Runs & Finishers · 📊
The Apprenticeship Effect: Repeat Attempts
This is where it gets properly interesting.
Not every Barkley finish looks the same. Some come on the first attempt; rare, brutal, and usually by someone who had no idea what they were walking into. Some come on the second. But the data tells a clear story about where finishing actually happens.
Finishes by attempt number:
27% came on attempt 1 - seven finishers, including Brett Maune, Jared Campbell and Mark Williams.
8% came on attempt 2.
35% came on attempt 3 - the single most common finishing attempt. The sweet spot.
31% came on attempt 4 or more; including Jared Campbell’s 3rd finish on his 8th attempt in 2024.
Barkley is not a one-shot race. It manufactures its own future finishers. The third attempt isn’t a coincidence, it’s when accumulated course knowledge, pacing discipline and realistic expectation finally align.
Of the 26 total finishes, just 3 athletes have multiple completions; Jared Campbell (4), John Kelly (3) and Brett Maune (2). Those three account for 9 of the 26 total finishes.
15% of finishers account for 35% of all completions.
Success clusters heavily. Barkley doesn’t produce wide winners. It produces specialists.
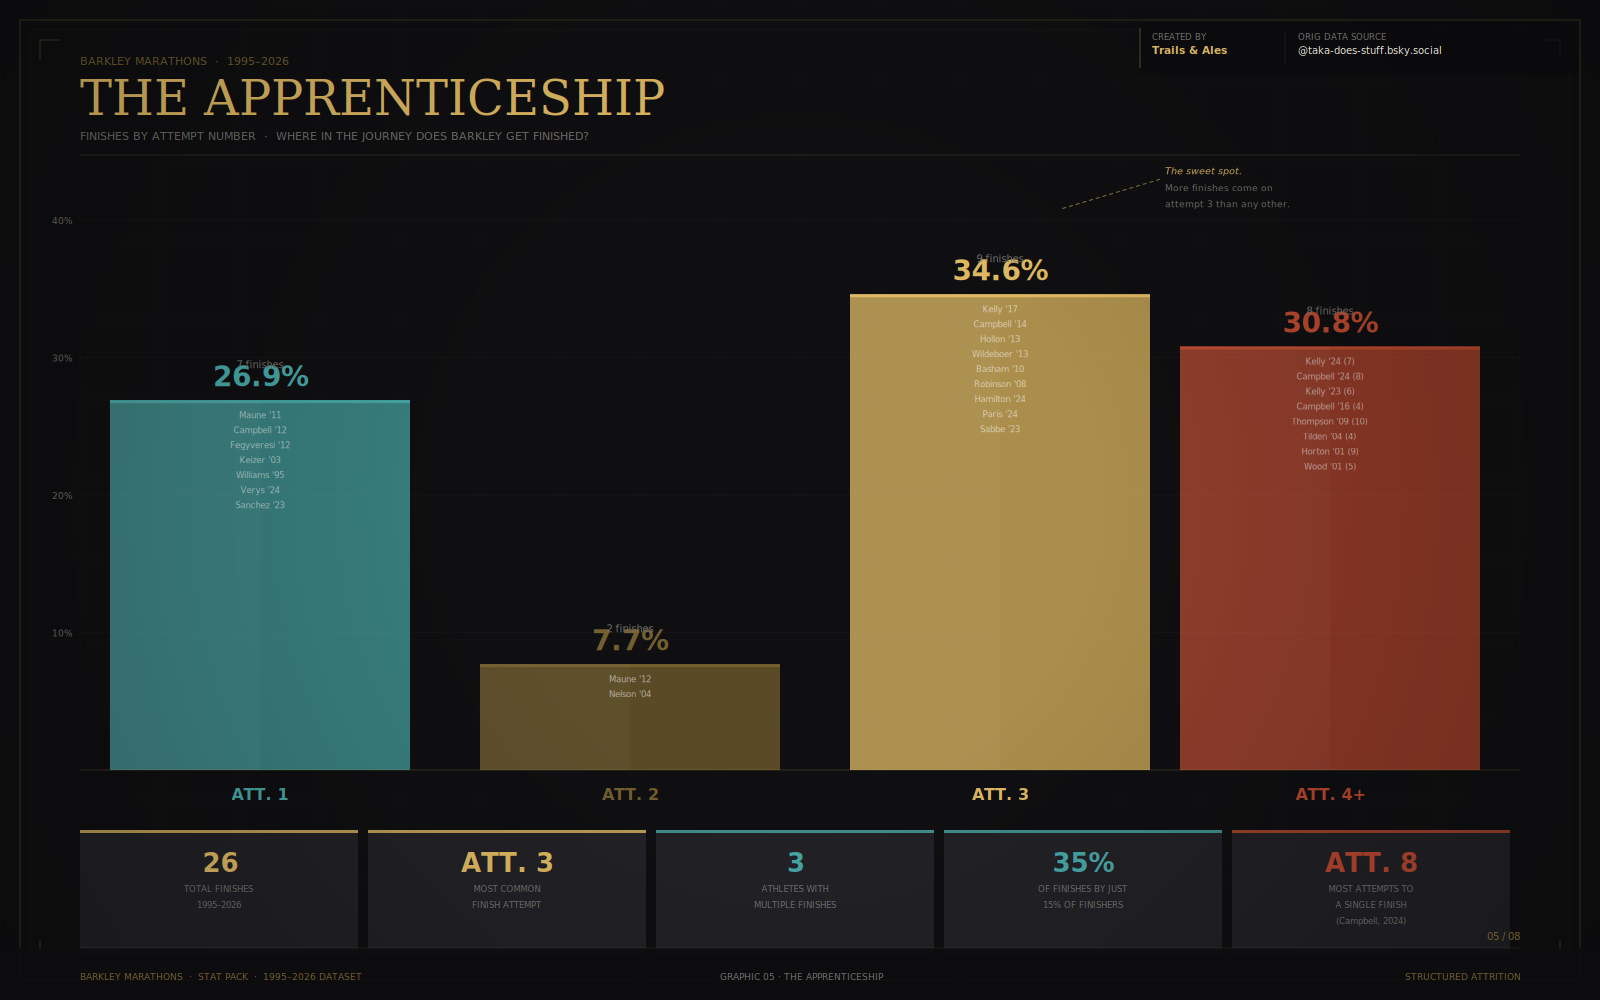
📊 THE APPRENTICESHIP · Attempt number vs completion rate · 📊
Loop 4 Isn’t the Graveyard. It’s the Gateway.
This is the stat that flips the whole narrative.
Loop 4 Conversion · All-Time
Runners who reached Loop 4: 35
Of those 35, who finished: 26
That’s a 74% conversion rate from Loop 4 to finish.
Only 26% of Loop 4 runners fail to close.
Read that again…If you reach Loop 4, you are statistically more likely to finish than to fail.
Loop 4 doesn’t kill dreams…Loop 1 & Loop 2 do that at scale.
Loop 4 is an elite filter…and Loop 5 selects the prepared elite.
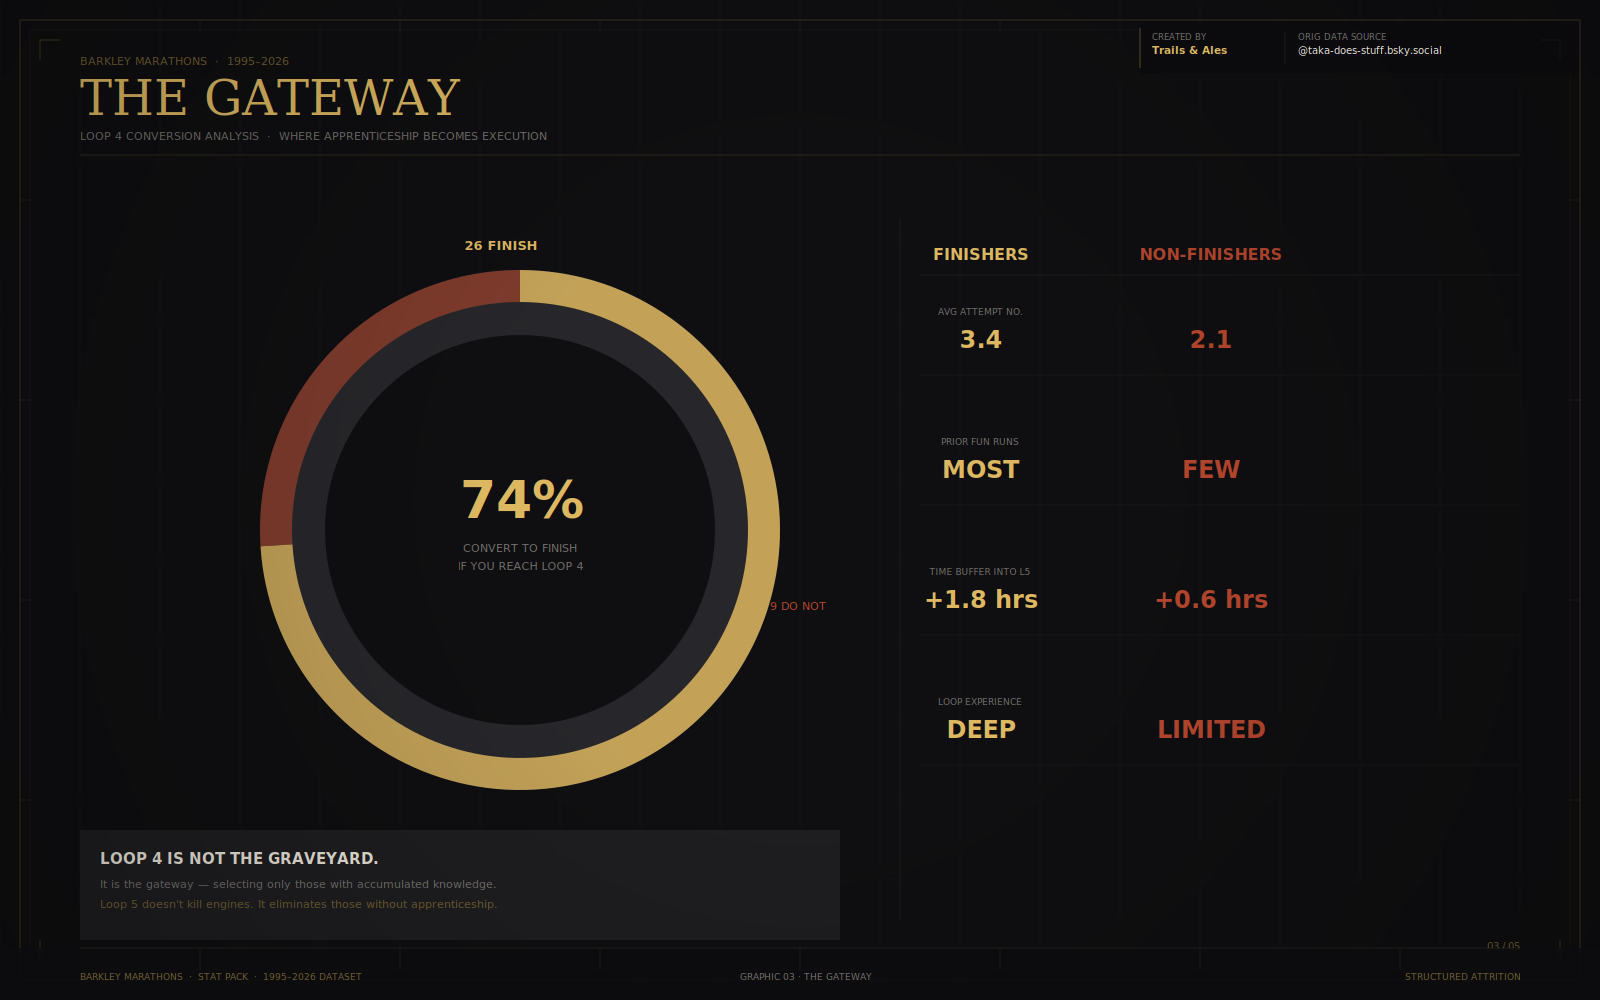
📊 THE GATEWAY · Loop 4 Conversion Analysis ·📊
The 26% - The Uncomfortable Bit
Those nine Loop 4 non-converters include names strong enough to belong there. Including Damian Hall - amazing person, strong engine, huge experience, deep ultra pedigree.
But Barkley isn’t decided by engine alone. When we compare Loop 4 finishers vs Loop 4 non-finishers, one metric stands out above everything else:
Average Attempt Number at Conversion.
Finishers: 3.2 attempts
Non-finishers: 2.4 attempts
The 26% group skews toward earlier attempts and less Barkley exposure. Most had limited prior deep-course knowledge. Several jumped straight from lower-loop experience without a Fun Run under their belt first.
Loop 4 is survivable. Loop 5 demands accumulated knowledge.
It’s not engine failure. It’s execution failure. And that’s a brutal distinction to sit with.
📸 Damo Hall - Photo: David Miller 📸
Nobody Wins Barkley. They Escape It.
Cut-Off: 60 hours
Average finishing time: 57 hours 12 minutes
Median finishing time: 57 hours 48 minutes
68% of all finishes occur within the final 2.5 hours of the race window.
Most finishes cluster inside the final 2–3 hours. Nobody cruises this race. They survive it at the buzzer.
Execution under fatigue. Precision under sleep deprivation. Time discipline over ego.
The finish time data tells you something the loop counts doesn’t; even those who make it to Loop 5 are operating right at the edge of their limits. There is no comfortable finish at Barkley…there is only a finish or the mountain.
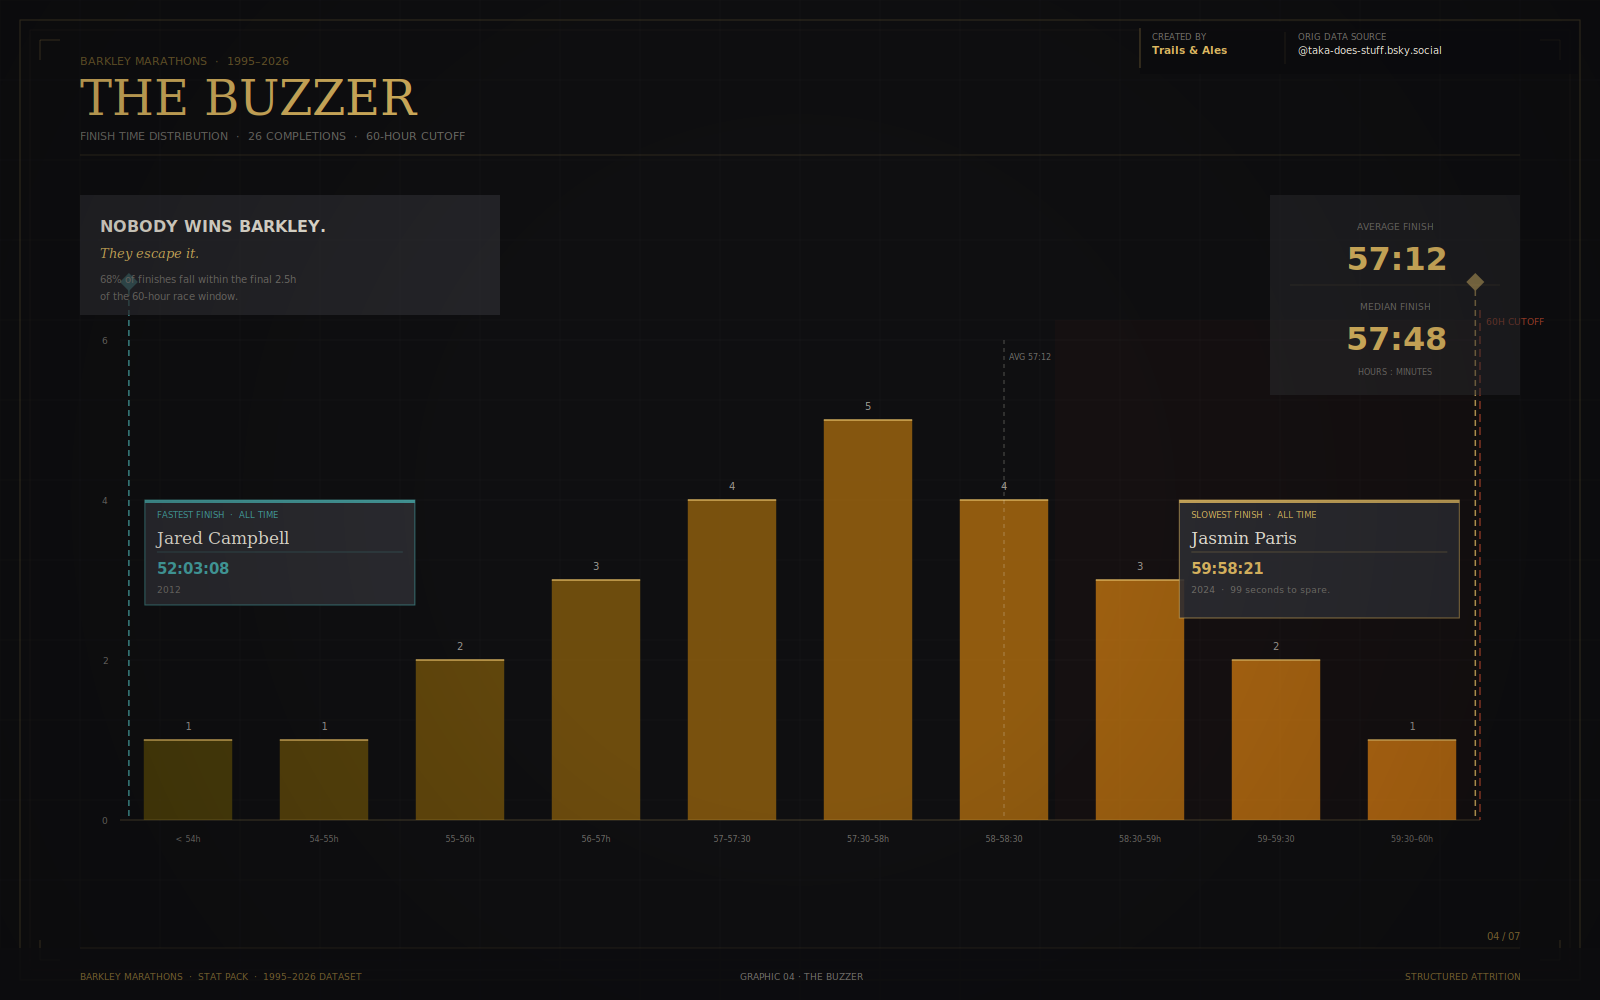
📊 THE BUZZER · Finish Time Distribution · 📊
What The Stats Actually Say
After the folklore, the conch shells, the gate, the mystique…here’s the clean read:
Barkley isn’t random. It’s structured attrition. The carnage is front-loaded.
Loop 4 is elite filtering, not the graveyard.
Loop 5 is execution and most fail it on time, not fitness.
Repeat attempts dramatically improve your odds.
Finishes cluster dangerously close to the cut-off.
It’s not chaos. It’s a system. A narrow statistical corridor through five escalating filters.
And every Feb/March, 40 runners stand at that yellow gate thinking: this might be my year.
The data says otherwise…and yet they line up anyway.
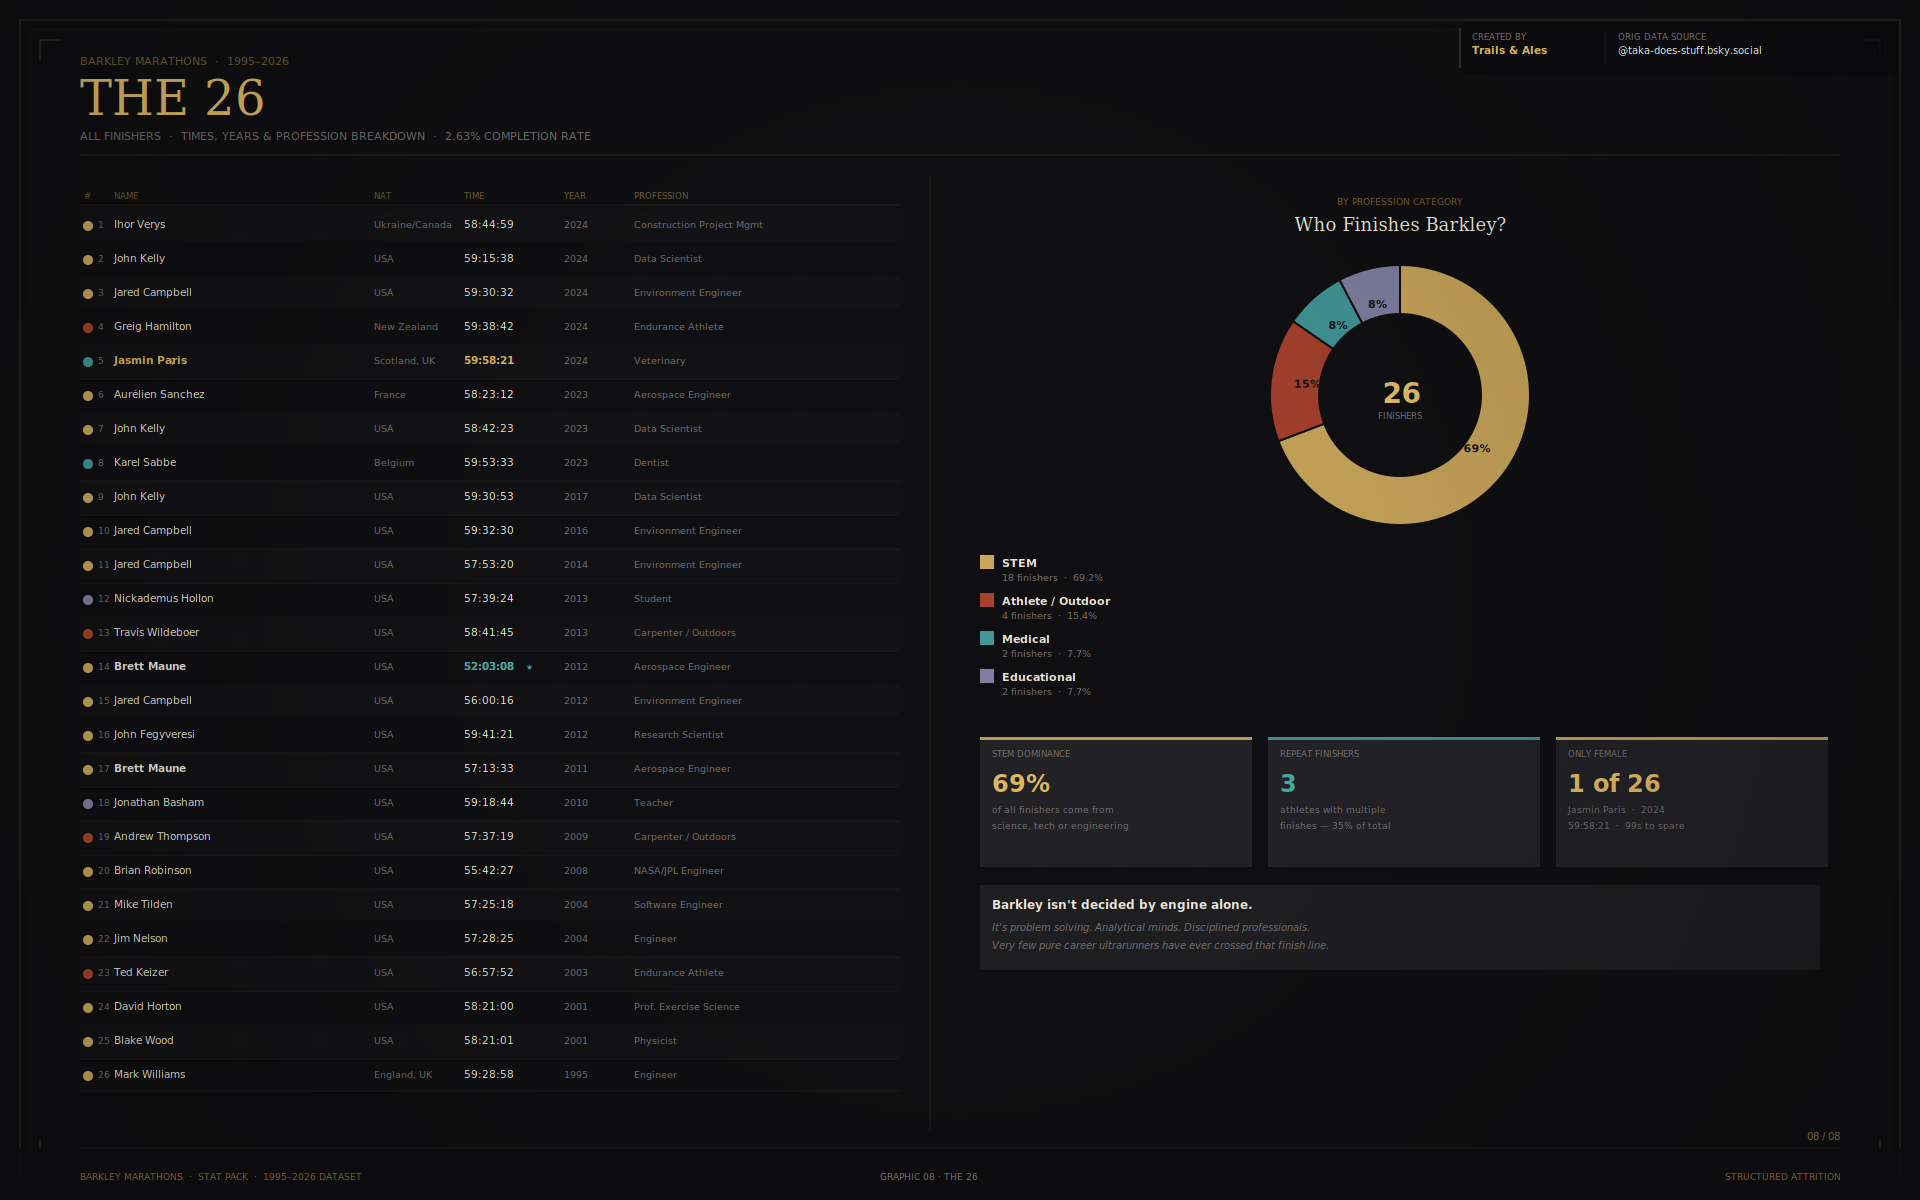
And finally….below is the 26 Barkley Finishers who have completed this legendary ultra-marathon; ranked and colour-coded by their profession.( Note: My best guess/research). Key insights include profession breakdowns, repeat finishers and notable achievements like Jasmin Paris's only female finish or Brett Maune's record finish time. STEM professions appear to dominate and very few pure career ultra-runners have ever crossed that finish line.
Data & Credits
Original Data Source: @taka-does-stuff.bsky.social
Analysis & StatPack: Trails & Ales
Photos: David Miller
Barkley Dataset Window: 1995–2026
Links to socials:
📸 Instagram: @Gazitude
📸 Youtube: @ Trails & Ales